Introduction
Editor Henry H. Bauer published in JSE Issue 21.3 (October 2007) a letter written by Eltjo Haselhoff commenting this Grassi et al. paper.
Bauer introduced the letter and published also the Grassi et al. formal reply.
You can download the original JSE pdf file or you can directly read the web version below.
Francesco Grassi, Claudio Cocheo, Paolo Russo
Journal of Scientific Exploration Vol. 21, n.3, pp. 576-582, 2007
Letters to the Editor
More About Crop Circles
The following exchange about an article previously published in the Journal of Scientific Exploration exceeds in length our guidelines for letters, and to some extent our guidelines as to precise focus on specific points. However, we felt obliged to allow Haselhoff to have his say after our publication of a piece that had criticized some of his writings.
That earlier piece we had published, as noted at the time, because the journal that had disseminated the work being commented on had refused to accept this commentary – in retrospect, it regretted having given any space at all to the matter of crop circles. The Journal of Scientific Exploration, of course, is open precisely to topics excluded from venues of orthodoxy, and we also believe that a journal that has published something should permit at least one dissenting critique.
However, we will call a halt at this stage to the present to-and-fro. Any future submissions on the question of crop circles will need to be full manuscripts, and will be reviewed under our customary stringency as to focus, presented evidence, statistical inference, and logical discussion.
Henry H. Bauer
Haselhoff Responds to "Balls of Light: The Questionable Science of Crop Circles"
I would like to comment on a paper in your Journal (Grassi, Cocheo, & Russo, 2005) that criticizes three other papers, two of which were written by the BLT Research Group (Levengood 1994; Levengood & Talbott, 1999) and one was written by myself (Haselhoff, 2001). The analysis by Grassi et al. contains several serious mistakes, which renders most of their conclusions invalid.
First, Grassi et al. criticize the simplicity and question the physical validity of the balls of light (BOL) model as suggested in my comment (Haselhoff, 2001). They require explicit inclusion of mechanisms such as cumulative energy absorption, effects of moisture, reflection, spectral distribution, and the incident angle of the alleged radiation source. Although these suggestions are valid recommendations for future research, I believe they cannot be taken seriously as a point of criticism of my comment, which was merely suggesting a modification of the interpretations by the BLT Research Group. The modified interpretation matches an apparently genuine physical counterpart, namely, the "balls of light" that have been witnessed and filmed in and around several crop formations. Moreover, the suggestions for extension of the BOL model made by Grassi et al. are not realistic because the results published by BLT (Levengood & Talbott, 1999) are not based on laboratory experiments, performed in a controlled environment, but on an analysis of circumstantial evidence, in the form of an apparent leftover of a largely unknown process. With the currently available data, the implementation of an advanced physical model like Grassi et al. suggest will only raise more questions than it could ever answer.
Next, Grassi et al. (2005: p. 163) go into some depth with respect to what they call a "questionable sampling strategy". It is unfortunate that they neglect to make a clear distinction between the fieldwork performed by BLT versus the additional verifications by myself (carried out using the same field protocols). The concerns that Grassi et al. raise with respect to the choice of controls, the inclusion or exclusion of standing stems in the analyses, etc., are all results of a profound misunderstanding of the work by BLT. Grassi et al. (2005: p. 165) demonstrate this at several points in their paper, e.g., when they state that "No statistical tests have been performed to compare means and variances", while this is a standard procedure for all work carried out by BLT. Moreover, it was also clearly stated by BLT in their papers that standard t-tests were performed, and that all results obeyed the common p < 0.05 criteria. Grassi et al. (2005: p. 166) demonstrate their poor understanding of these matters in their Tables 2a and 2b. These tables are used to question the statistical validity and the physical meaning of the BOL model, based on a calculation of p-values. First of all, the p-values published in Table 2a for the height parameter h are not the values for h, but for h². It is easy to understand that the p-values for h² are considerably higher. Much worse, however, is that all p-values published by Grassi et al. correspond to the case of single node length measurements, i.e., the measurement of single nodes at various positions in the field (N = 1). This, of course, was not the case, and Grassi et al. even report themselves that all node lengths used in the analysis by BLT were average values of 15-20 nodes for each position in the field, whereas – as explicitly reported by BLT in their papers – all variations in node length were in fact statistically significant. The fact that Grassi et al. clearly failed to recognize this, renders their entire statistical analysis invalid, along with most of the conclusions in their paper.
The crux of the work presented by BLT was the discovery that node lengths in a field with crop formations sometimes show statistically significant (p < 0.05) variations, geometrically correlated to the imprints in the fields, both in flattened and in standing crop. This remains an interesting finding, which I still believe requires further study. However, this essential fact was clearly not understood by Grassi et al.
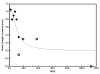
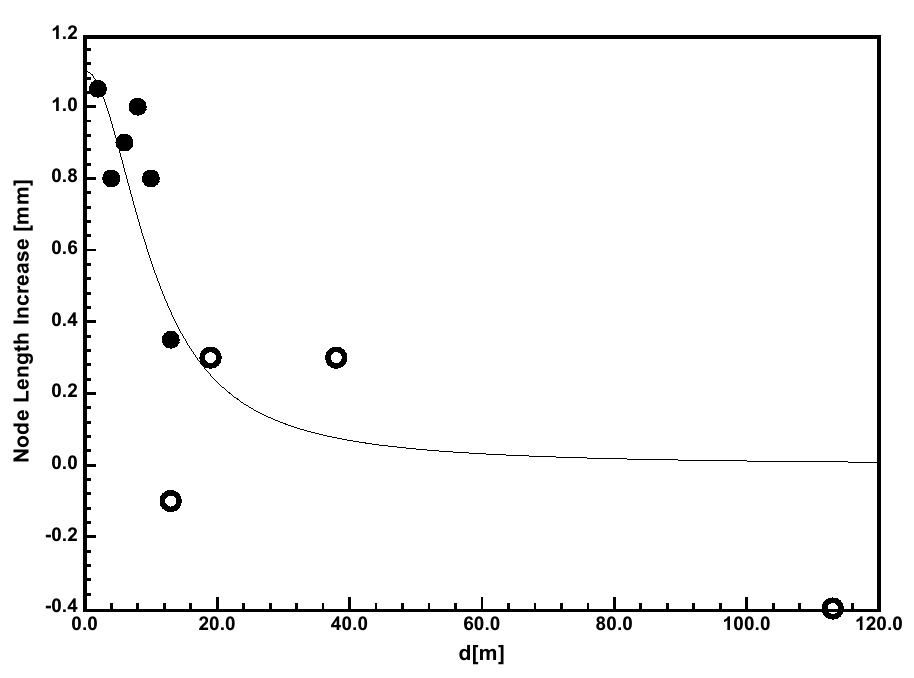
Also some remarks must be made with regard to the analysis by Grassi et al. of the Nieuwerkerk formation. Their findings are exclusively based on raw data, which I sent to them at their request. The spreadsheet only contained raw numbers with a minimum of explanations, but despite the fact that we later communicated several times, Grassi et al. never discussed the interpretation of my data with me until after the press release announcing their publication. As a result, some unfortunate mistakes have been made. For example, the positions of the control samples that Grassi et al. assumed, and used in their analysis, were all wrong. A more relevant point of concern is related to the alternative outcome for the correlation coefficient, as presented by Grassi et al., by using the average values of corresponding samples in two different radial sample sets. This is not allowed because such an approach would require the explicit assumption of circular symmetry of the node length distribution in the crop circle. Obviously, such an assumption cannot be made a priori because this is exactly the issue that the BOL analysis should investigate. Subsequently, the authors also include the samples outside the flattened area in their analysis despite the fact that these had already been used for the determination of the control value (Grassi, 2006). In this way they manage to increase the correlation coefficient to R² = 0.699, and they conclude that the man-made formation reveals characteristics of a "genuine" crop circle. However, the inclusion of the extra data does not at all demonstrate a better fit to the BOL model despite the (moderate) increase of the correlation coefficient. This can be seen in Figure 1, where the data points added by Grassi et al. are shown as open dots. Two of the added data points even represent a shrinkage of the node length (the node length increase is negative), violating the assumptions of the BOL model. Apparently, the correlation coefficient alone is not an adequate indicator. The reasoning of Grassi et al. in this matter is flawed and has no physical counterpart, so that their conclusion is invalid. In order to reach solid conclusions in this matter, more statistical data on man-made formations is needed by performing new, original research. This is the basis of an ongoing study carried out by myself and others, to be published later this year.
(click to enlarge)
Fig. 1. Analysis of the Nieuwerkerk formation as carried out by Grassi et al. Horizontal axis: distance from circle center; vertical axis: node length increase. The open dots represent data added by Grassi et al. According to the authors, these improve the fit to the BOL model (indicated by the solid curve). However, the horizontal coordinates of the three rightmost open dots are not correct, whereas two open dots correspond to node length decrease, hence violating the BOL model.
Fig. 1. Analysis of the Nieuwerkerk formation as carried out by Grassi et al. Horizontal axis: distance from circle center; vertical axis: node length increase. The open dots represent data added by Grassi et al. According to the authors, these improve the fit to the BOL model (indicated by the solid curve). However, the horizontal coordinates of the three rightmost open dots are not correct, whereas two open dots correspond to node length decrease, hence violating the BOL model.
Summarizing, Grassi et al. conclude that the findings presented by BLT (Levengood 1994; Levengood and Talbott, 1999) demonstrate nothing but a difference in node elongation between flattened and upright plants, which could be the result of whatever flattening mechanism. Their conclusion is in line with their erroneous statistical analysis, for which each data pair is incorrectly interpreted as the result of a single stem measurement. In reality, however, all reported variances in node length were statistically significant, with a clear correlation to the geometrical imprints in the field, i.e., depending on the linear distance from the imprints. The fact that this crucial aspect of the two BLT papers was not recognized by Grassi et al. renders most of their statements invalid.
Despite the fact that I would have preferred a more open and particularly a more honest communication, I would like to thank Mr. Grassi and his co-authors for their interest in our work. Their recommendations will be considered for future research.
Eltjo H. Haselhoff
References
Grassi, F. (2006). Personal communication.
Grassi, F., Cocheo, C., & Russo, P. (2005). Balls of light: the questionable science of crop circles. Journal of Scientific Exploration, 19(2), 159-170.
Haselhoff, E. H. (2001). Opinions and comments on Levengood WC, Talbott NP (1999). Phys. Plantarum, 111, 123-125.
Levengood, W. C. (1994). Anatomical Anomalies in Crop Formation Plants. Phys. Plantarum, 92, 356-363.
Levengood, W. C., & Talbott, N. P. (1999). Dispersion of Energies in World Wide Crop Formations. Phys. Plantarum, 105, 615-624.
Grassi, Cocheo, and Russo's Reply
Haselhoff's remarks are welcome, but unfortunately they are not relevant, as we are going to explain.
About the BOL model complexity: to make a simple model is good, but to make it unrealistic is not. Factors can be eliminated only after their impact has been estimated as unimportant; no such assumption can be made without an analysis. In particular, the transparency of the tissue to the radiation looks like a relevant factor that should not be eliminated without justification: a perfectly transparent tissue would not be affected at all, while a non-transparent stem would partially shield its nodes from radiation, depending on the incidence angle. The correctness of a model is independent of whether the environment is controlled or not. It is obvious that a more complex model may require more data to be validated, but this can hardly justify not making a correct model.
Haselhoff[1] already tried to justify some weak points of his paper on the basis that it was a mere comment; as we explained,[2] we think it is not a valid justification. The "apparently genuine" witness and film evidence for BOLs mentioned by Haselhoff is questionable for scientific purposes. A survey would be out of place here; we just supply a few links[3] to some information about the only named witness in Haselhoff's comment paper so that the reader can judge how "apparently genuine" his claims are.
About our supposed misunderstanding of BLT's and Haselhoff's data handling: although Haselhoff seems to disagree, BLT never wrote (in any of their scientific papers, at least) about t-tests on the data of the Devizes, Chehalis, and Sussex formations. The claims by BLT and Haselhoff that we discussed were based only on those three formations. BLT did mention t-tests for other data (Beckhampton, Maryland) and that is all. Should we – or anybody – be expected to guess about unpublished tests? However, t-tests should be addressed to compare the averages of the sample groups collected, but, as we clearly stated in our conclusions, we did not dispute the average difference between samples collected in and out of the formation; rather, we highlighted the lack of a reliable criterion for labelling the data as "affected" or "control".
We computed the p-value for h², not for h, because errors propagate from the data to h² in the model, so h² is the term whose significance has to be taken into account. Interpreting that term as the square (or cube or nth power) of something else does not change the model curve.
It is curious that Haselhoff points out that we "incorrectly" handled the data as if they were single samples because that is exactly how he and BLT handled them in their regressions; should they have taken the number and variance of samples into account, the resulting correlation coefficients would have been much lower. Maybe the result would have been significant, but a significant mismatch. Since there may be some rationales for regressing the data in that way, instead of raising another issue, our goal was just to evaluate the significance of their regressions – just as they were. However, our first remark in this area was (and is) that both the number of circles taken into account and the number of samples collected in each are inadequate for a reliable statistical analysis; many of the specific problems we discussed are just a consequence.
Haselhoff misrepresents his and BLT's work when he states that they just found apparently non-random patterns deserving – in their opinion – of further study. First, the alleged t-tests mentioned by Haselhoff would not support the presence of any pattern anyway, but only the undisputed fact that in any circle – known man-made formations included – inner plants have longer nodes than outer ones. But even if the existence of a generic decrease-with-distance trend should be proved, it would be a very humble and unsurprising conclusion because it would bear no indication of any specific cause; possible causes include mundane factors such as the dynamics of wind near the circle borders and the behavior of circlemakers. On the contrary, the titles of their papers contain words like "anomalies" and "energies" and the texts go far beyond. We already replied to Haselhoff's past minimization attempts.[2]
About Nieuwerkerk: the position of the control samples is not so wrong. Haselhoff[4] sent us a file listing the sample values and distances from the center of a circle; he only recently informed us that the control samples were taken at the listed distances, but from another circle in the same formation. However, those two circles were identical under all respects due to the symmetry of the formation, and there is no reason to suppose different creation mechanisms, and thus we fail to appreciate the relevance of Haselhoff's comment. Anyway, even accepting that supposition and using the corrected distance from the corrected circle, the correlation coefficient does not change significantly. About Haselhoff's other comments on the same circle: he would be correct if we ever claimed that the Nieuwerkerk circle (a known man-made formation) had actually been created by a BOL. Of course, we never did; our purpose was entirely different. BLT's and Haselhoff's conclusions were based on just three crop circles, each one sampled in just a few points with no bidimensional information. Moreover, the classification of samples as "affected" or "control" looked arbitrary and decided after the values were known; no comparison with alternative and possibly better fitting or physically more founded models was tried. Isn't this procedure questionable? Can't it lead to spurious positive-looking results? Not only did we explain the reasons, but we added an example. We considered the known man-made Nieuwerkerk circle, which Haselhoff sampled and used as an example of a negative result, and we handled it in the same way the other circles had been. We averaged two data sets, taken along different radii, both to eliminate the bidimensional information (anyway, as a consequence of the BOL spherical symmetry, no changes have to be expected by varying the direction of the radius, the only variation depending on the distance from the center) and to reduce the number of samples (to seven), so that no more information was available about that circle than it was for the other ones, in order to allow for a fair comparison. Then we aggregated the data as affected/control in various sensible ways, showing how the resulting correlation coefficient was affected by an arbitrary choice of each of them; the way mentioned by Haselhoff was just the last one. We do agree that the positive-looking result we obtained with a few arbitrarily aggregated data should not be taken seriously, but that exactly proves our point that Haselhoff seems to miss. He misses it even more when he proposes that if any sample value is less than the control level (an apparent "shrinking"), then the model should be rejected. He cannot really think that nodes near man-made circles do shrink; that is just data variability and is already adequately handled by statistical tests. Nonetheless, we would accept Haselhoff's rule if only it had been stated in advance; adjusting criteria after looking at the results is exactly one of the questionable practices we criticized.
Finally, about the Nieuwerkerk circle, Haselhoff concludes with the admission that "apparently, the correlation coefficient alone is not an adequate indicator". This is exactly our criticism of his work. We agree with him: a correlation coefficient alone is not an adequate indicator. But that is the only indicator used by Haselhoff himself to try to demonstrate the existence of a BOL. So, Haselhoff himself is admitting that the whole corpus of his work is supported only by an indicator whose adequacy is questionable.
We would also like to point out that Haselhoff's reply does not address several points we made, for example, the incoherence of the proposed physical mechanism (thermal dilation of water) and the exclusion of several data from the analysis (central tufts, Beckhampton circle).
In conclusion, Haselhoff's remarks are welcome, but they do not contribute to make his paper more reliable, nor to invalidate our criticisms of it.
Francesco Grassi
Claudio Cocheo
Paolo Russo
References
1) http://www.cicap.org/crops/en/011.htm . Accessed 26 July 2007.
2) http://www.cicap.org/crops/en/012.htm . Accessed 26 July 2007.
3) http://www.cicap.org/crops/en/cache/001.htm#i1 . Accessed 26 July 2007.
http://www.cicap.org/crops/en/cache/002.htm#i6 . Accessed 26 July 2007.
http://www.cicap.org/crops/en/cache/003.htm . Accessed 26 July 2007.
http://www.cicap.org/crops/en/cache/004.htm (for witness identity verification). Accessed 26 July 2007.
http://www.cicap.org/crops/en/cache/002.htm#i6 . Accessed 26 July 2007.
http://www.cicap.org/crops/en/cache/003.htm . Accessed 26 July 2007.
http://www.cicap.org/crops/en/cache/004.htm (for witness identity verification). Accessed 26 July 2007.
4) Haselhoff, E. H. (2001). Personal communication.